Exploit the Potential of the GA4 Interface with Collections

Pierre Adrien Lair, Lead Analytics at Converteo, is an expert in Data & Analytics. He supports our clients in collecting and analyzing data from the digital marketing ecosystem.
With the cessation of data processing for Universal Analytics accounts since July 1, 2023, for free accounts, mastering its replacement, Google Analytics 4, has become essential.
The tool is sometimes criticized for its interface or missing features. However, it quickly becomes forgotten that it offers numerous relevant functionalities that are, according to our observations, underutilized.
Among these, we wanted to highlight a particularly interesting feature of the solution: Collections.
How to create them, how to use them for the needs of your organization, tips for circumventing certain limitations, and saving time… I will reveal my favorite hack for finding standard reports from Universal Analytics in the GA4 interface.
Collections: Definition
Collections are a feature in GA4 that allows you to organize sets of reports within a library.
These collections are found in the Reports tab of GA4. They constitute the menu and navigation within the interface.
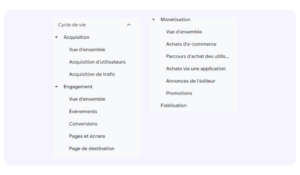
The first time you enter the interface, you will find default collections: Lifecycle, User. These collections help you familiarize yourself with the interface by including the main standard reports useful for web analysts.
Lifecycle Collection
Types of Reports
The Collections are composed of two types of reports:
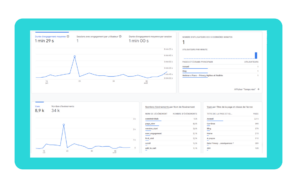
- Overview Reports: An overview report provides a summary of your main analysis tables and indicators, gathering various cards that serve as links to your detailed reports.
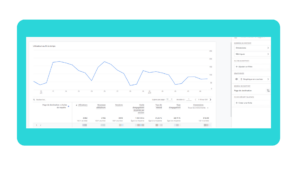
- Detailed reports consist of a data table and 1 to 2 associated data visualizations.
Collections: How to Create Them ?
To create a collection, simply navigate to the “Library” section and click on “Create a collection.”
By default, GA4 offers 6 collection templates, some of which are essential. I recommend immediately adding the “Search Console” collection, which will allow my favorite SEOs to access reports related to the Search Console, including Search Query, Landing Page cross-referenced by Impressions / Clicks / CTR / Position.
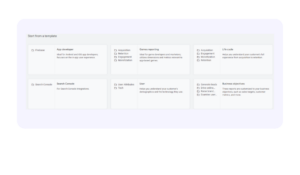
We also find an interesting template associated with “Business Objectives” that allows grouping reports according to several themes:
- Generate leads/prospects: it includes audience reports, acquisition reports, and landing page reports.
- Increase online sales: e-commerce reports, promotions, and purchase journey reports.
- Improve brand awareness: demographic reports and page reports.
- Examine visitor behavior: generic reports on events and conversions.
Limitations to be Aware of
Before diving headfirst into creating your first collections, it is important to be aware of a few technical limitations of this feature:
- 7 collections maximum per GA4 property
- 5 themes per collection
- 1 overview report + 10 detailed reports per theme
Now that we know all this, you can create your first ad-hoc collections.
The Collections: How to Leverage Them for Your Organization?
The most fundamental collection to utilize is the empty collection!
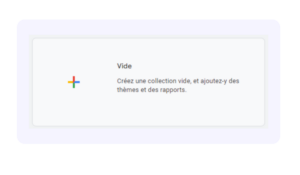
Indeed, this will allow you to create a customized interface that aligns with your organization and the users of the solution.
I suggest a few examples of collections that we implement for our clients based on their organization (by market, by team) and their analytical needs, which can serve as points of consideration to adapt to your interface.
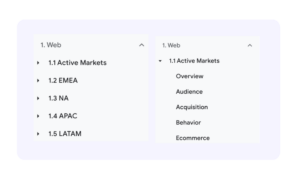
A global organization
In this case, one could imagine a collection that includes various generic reports, filtered according to the domain names of your teams’ regions.
EMEA
- Acquisition reports
- Event reports
- E-commerce reports
- …
APAC
- Acquisition reports
- Event reports
- E-commerce reports
- …
An organization by expertise
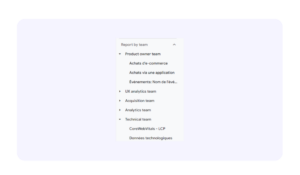
Reports will be divided according to key areas of expertise.
Acquisition Teams
- Landing Pages x Search Console
- Google Ads Performance
- Session Performance by Source/Medium
Technical Teams
- Performance by Browser/OS/Device
Merchandising Teams
- Promotions
- E-commerce Funnel Behavior
- Product Performance
A nostalgic organization for Universal Analytics
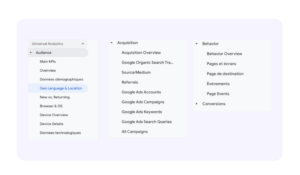
Many consider that the classification provided in Universal Analytics was logical. In that case, it’s worth recreating it in GA4!
Audience
- New vs. Returning
- Cities
- Devices
Acquisition
- Source/Medium
- Google Ads
- Campaigns
Behavior
- Landing Pages
- Exit Pages
- Events
Conversions
- Top Conversions
- E-commerce Reports
My advice: talk with your teams, review their analysis needs, and create a customized UI.
Hack the collections and save time
The limits of reports… and a possible workaround
Let’s say you want to recreate your favorite reports from Universal Analytics. You go to the interface: Library > Create a report > Create a detailed report.
You quickly encounter certain limitations:
- Lack of dimensions in the interface
- Unable to filter on specific events
- Unable to set more than two primary dimensions.
Well, what if I told you that some of these limitations can be bypassed?
Indeed, each report creation generates a unique URL: if you create a report with “Device Category” / “Conversions” and apply a filter “Language Code” contains “fr,” a specific URL is generated.
https://analytics.google.com/analytics/web/#/p123456789/assetlibrary/explorer/new?params=_u..nav%3Dmaui%26_r.explorerCard..dimensions%3D%5B%22deviceCategory%22%5D%26_r.explorerCard..seldim%3D%5B%22deviceCategory%22%5D%26_r.explorerCard..metrics%3D%5B%22conversions%22%5D%26_r.explorerCard..selmet%3D%5B%22conversions%22%5D%26_r.explorerCard..sortKey%3Dconversions%26_r.explorerCard..isAscending%3Dfalse%26_r..dataFilters%3D%5B%7B%22type%22:1,%22fieldName%22:%22userDefaultLanguage%22,%22evaluationType%22:3,%22expressionList%22:%5B%22fr%22%5D,%22complement%22:false,%22isCaseSensitive%22:true,%22expression%22:%22%22%7D%5D&r=new-report
To those interested in reverse engineering: let’s break down this URL and focus on the key components:
- p123456789: This is the ID of your property.
- _r.explorerCard..dimensions%3D%5B%22deviceCategory%22%5D This part lists the selected dimensions.
You can find the name of all dimensions on the front-end using the excellent site: https://data.ga4spy.com/.
- _r.explorerCard..seldim%3D%5B%22deviceCategory%22%5D: Lists the dimensions present in your table.
- _r.explorerCard..metrics%3D%5B%22conversions%22%5D: Lists your metrics.
- _r..dataFilters%3D%5B%7B%22type%22:1,%22fieldName%22:%22userDefaultLanguage%22,%22evaluationType%22:3,%22expressionList%22:%5B%22fr%22%5D: Specifies the filter. For example, “contains” equals 3, “regex” equals 2, etc.
- &r=new-report: Creates the report.
The subtlety is that you can manipulate all these parameters…
Thus: dimensions not available in the interface do exist and are usable! I’m not sure how long this technique will remain effective, but it works.
Here’s an example: missing the New vs Returning report? Well, it exists:
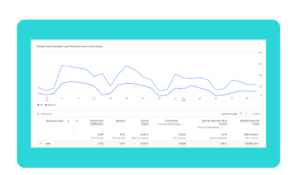
And it then becomes possible to recreate a card that seemed impossible to achieve:
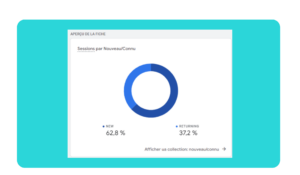
In the same way, by manipulating the URL, you can add 2, 3, or 4 columns (using the seldim parameter) or filter on elements that are not available by default: for example, ensuring that “transactionId” does not contain “(not set),” which will make certain e-commerce reports more readable.
Be cautious with this trick: not everything is compatible, and if certain dimensions/metrics don’t appear in the interface, there might be a reason. During your tests, you’ll likely encounter many “blank” reports. Feel free to contact us to discuss further!
Perspectives
Collections is a fundamental feature for the adoption of GA4. The interface is highly customizable to closely align with the business needs of a team or organization.
While templates can save time, creating your own collections is more powerful.
However, their implementation can sometimes be complex: why aren’t all the dimensions and metrics available in the API, Explore reports, or backend selectable? This is where all the tips presented in the article come into play, summarized at Converteo in a magnificent drag-and-drop “Collections Builder” spreadsheet.
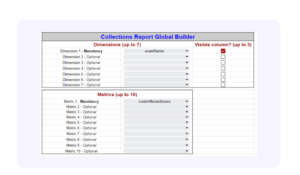
The tool itself will continue to evolve, and there’s no doubt that these various patches will address the limitations discussed. For those who’ve been around longer, remember when we used to manipulate URLs to display more than 5,000 rows in a data table!
I hope you find this presentation of collections in GA4 and the associated tips helpful.

