
Using Looker Studio with Piano Analytics Data


Mirana Rakotoarivony, a consultant at Converteo within the Analytics & Conversion practice, specializes in topics related to Piano Analytics.
Following the formal notice issued to Google Analytics (GA) by the CNIL in January 2022, some advertisers turned to Piano to meet their analytics needs. The web analysts of these brands had become accustomed to using Looker Studio, GA’s native data visualization tool, for its ease of use and sharing capabilities.
Piano has its own integrated data visualization module: “Dashboard”; however, habits die hard, and many analysts wanted to continue using Looker Studio with Piano for its intuitive interface and ability to connect to other data sources.
The good news is that there is a native connector that allows you to easily import your Piano Analytics data into Google Looker Studio. It is therefore entirely possible to rebuild your Looker reports using data from Piano Analytics! However, using Looker Studio with Piano can be challenging due to certain subtleties.
In this article, we will guide you in building your Looker Studio dashboards with your Piano data, keeping in mind these key points of attention. Whether you are a web analytics expert or a curious novice, we have gathered, with the help of Piano support, the best practices to make the most of these two tools!
Prerequisites:
- Access to Piano Analytics
- Piano API key (available directly in the interface)
Piano has created a simple step-by-step tutorial for this integration: see the tutorial.
1) Reproducing Piano Segments in Looker Studio
Piano Reminder: Piano allows you to create segments of different scopes: “event,” “user,” “visitor,” and “visit” (see the details of Piano segment scopes).
- An event scope segment focuses the analysis on the occurrence of a specific event. It functions like a filter in Looker Studio. Therefore, in the same analysis, an event scope segment in Piano and a filter in Looker Studio will display the same results in their respective interfaces.
- In contrast, a segment of scope “visits,” “visitors,” or “users” displays all results of visits (or visitors/users, depending on the selected scope) during which the event occurred. There is no equivalent for these visit/visitor/user scope filters in Looker Studio, as the filters only operate under an “event” scope.
Limitations with Looker Studio: It is not possible to import Piano segments into Looker Studio.
Solutions:
- To reproduce event scope segments or Piano filters (you can apply filters directly to the elements of your Piano analyses instead of creating event segments), simply transcribe them into a filter in Looker Studio.
- To reproduce visit, visitor, and user scope segments, it is advisable to export custom metrics from Piano with the following scopes into Looker Studio. This method allows for pre-calculating segmented metrics within Piano using the visit/visitor/user scopes so that the data arrives correctly processed in Looker.
▶ Tutorial: To do this, you need to create visit/visitor/user scope segments in Piano and add these segments to metrics to create custom metrics. Import the custom metrics into the Piano data source in Looker Studio. You can then perform your segmented analysis in Looker based on the custom metrics exported from Piano.
Steps to follow:
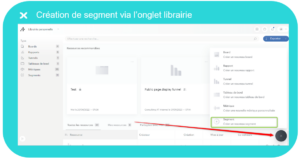
- From Piano, go to the “Library” tab (the centralized area for your saved custom resources: dashboards, segments, and metrics). In this tab, click on “+” then “Segment” to create a new segment.
2. Choose the scope of your segment, then apply the filters or sequencing (the different expected steps).
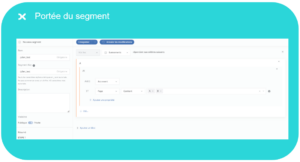
Finally, name your segment explicitly and save it.
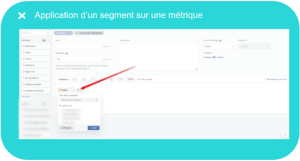
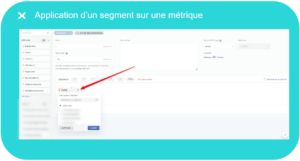
3. Once the segments are created, apply them to your metrics to create custom metrics.
▶️ Vidéo tutoriel du support Piano
Points of attention:
- Make sure to follow a clear naming convention for your custom metrics to easily find them in the dropdown list of metrics in Looker Studio.
- Ensure that your custom metrics are set to public, as they are configured as private by default. Private custom metrics will not appear in the Piano data source in Looker Studio.
4. In Looker Studio, refresh the Piano data source to import the custom metrics.

5. Conduct your analysis without adding a Looker Studio segment, but by directly using the segmented custom metrics. These will appear directly in the metrics of the Piano data source and will be easy to find using a few keywords if your naming convention has been properly established.
Key takeaways: Conducting segmented analyses in Looker is facilitated by using custom metrics exported from Piano.
2) Retrieving Accurate Totals for Piano Visits/Visitors in Looker Studio
Specificity of Piano: When analyzing traffic for a variable, such as page variables, the metrics “Visits” or “Visitors” are not summable. Piano counts occurrences of visit_id and visitor_id instead of summing the number of visits or visitors. Therefore, the “TOTAL” result line displayed in Piano shows the deduplicated result to avoid counting the same visit or visitor multiple times (see the details of this specificity in the Piano support documentation).
In practice: If a user views multiple pages during a single visit, there will be one visit recorded for each page, but globally for the site, it counts as only one visit. Thus, Piano correctly displays deduplicated visits in the Total line.
Limitation: Looker Studio does not deduplicate the metrics for Visits & Visitors as Piano does (because it lacks the necessary information to differentiate visits or visitors unless the identifier is included in the analysis). Looker Studio simply sums the rows, which likely results in higher totals than those shown in Piano, rendering the totals incorrect in Looker Studio.
Solution: Create a custom metric for “Visits” or “Visitors” by applying an event-scoped segment. By pre-calculating visits or visitors with event scope in Piano, the visits/visitors are deduplicated according to Piano’s logic, and the data is correctly processed in Looker.
▶ Tuto :
- Navigate to the ‘Library’ tab (the central area for your saved custom resources: dashboards, segments, and metrics) and create a segment:
2. Select an “event” scope and add filters on the variables (also referred to as properties in Piano).
3. Back in the Library, create a metric from the “Visits” or “Visitors” metric and apply the previously created segment to it.
▶️ Vidéo tutoriel du support Piano
(creation of custom metrics with an event scope segment applied to a visits/visitors metric)
Ensure to name your custom metric using an explicit nomenclature and set the metric to public, otherwise it will not be synchronized in Looker Studio. (see tip #1)
4. In Looker Studio, update the data from the Piano data source to see the newly created “Visits” or “Visitors” custom metric appear.
Key takeaways: Visits can be deduplicated in Looker Studio by applying an event scope segment.
3 ) Bypassing the native constraint of 10,000 rows per query from the Piano connector in Looker Studio
Limitations of Piano with Looker Studio: The connector linking Piano data to Looker Studio limits data queries, preventing the retrieval of more than 10,000 rows of results.
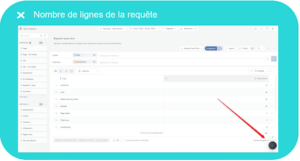
To determine if a query is limited, you must know the number of rows in the request and ensure that it does not exceed 10,000 rows.
Solutions: If the number of rows in the query exceeds 10,000, you can bypass the call limit:
- Filter and segment the data to reduce the results of the query and stay within the 10,000-row limit.
- Export Piano data as a CSV, since Looker Studio restricts the call from a Sheet data source to 200,000 rows.
- Use external tools like BigQuery to export dynamic data, circumventing the limits of the Piano to Looker Studio connector (which allows up to 200,000 rows).
Note that through a paid option, you can increase the default export limit from 200,000 rows to 1 million rows in CSV on Data Query. This option is not restricted to a specific type of contract and can be activated as needed.
▶ Tutorial:
- Display the number of rows in a query: To know the number of rows, you can try reproducing it in Data Query (the data exploration tool in Piano) by using only the variables (or properties in Piano) and metrics without filters or segments, then observing the number of rows:
2.Depending on the number of rows, circumvent the call limit:
- One method is to filter and segment to avoid exceeding the 10,000-row limit. For example, you can reduce the query period or filter certain variables (or properties in Piano) to limit the number of results and thus the size of the query.
Point of attention: Applying a filter directly from Looker Studio will not solve the problem, as Looker Studio applies filters after the query, rather than at the API call level. Consequently, only the 10,000 rows returned will be subject to the Looker filter, which skews the results.
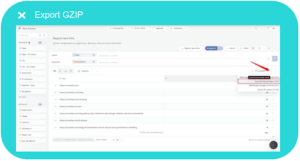
- Another solution is to export your analysis in GZIP format from Data Query over a specified period. You can then import it into Google Sheets and use it as a data source in Looker Studio, thereby increasing the limit from 10,000 rows to 200,000 rows.
-
Finally, to avoid being limited to a fixed analysis period while also bypassing the constraints of the connector, leverage BigQuery. Feel free to consult Piano’s documentation on Big Data projects using Piano Analytics data.
Key takeaways: Bypassing the native constraint of 10,000 rows per query from the Piano connector in Looker Studio involves applying filters and segments to the results, exporting the data in CSV format, or using external tools like BigQuery.
4) Bypassing the Limit of 5 Simultaneous “Heavy” API Calls in Looker Studio
Piano Specificity: In Looker Studio reports, the Piano API only supports 5 simultaneous calls for “heavy” datasets per page and per user (account holder). Here, “heavy” datasets are considered by the Piano API when the queries are made over a large date range and with numerous parameters. At the organizational level, the API restricts simultaneous “heavy” calls to 20 per page for the enterprise.
Limit in Looker: In Looker Studio, if you make calls to “heavy” datasets, the charts may take a long time to load or return an error if more than 5 charts are loading simultaneously (i.e., if they are on the same page).
Solutions:
- Create Multiple Pages in Looker Studio: Since the limit applies per page, you can create new pages to display different data.
- Multiply Piano Data Sources per User in Looker: Since the limit only applies per user, you can share your dashboard with another user who has access to Piano, allowing them to create 5 additional charts on the same page using their own data source linked to their Piano account. This way, you can add up to 20 chart boxes (recall that the simultaneous “heavy” call limit is 20 per organization) on a single page. See the tutorial on creating a Piano API to add a Piano data source to Looker Studio.
- Export Static Data from Piano to Sheets or Dynamic Data to BigQuery: Reimport these into Looker Studio via these sources instead of through the connector (see tip #3). Using these sources in Looker Studio allows you to bypass the connector limits, including the simultaneous “heavy” call limit.
Key Takeaways: To bypass the limit of 5 simultaneous “heavy” calls from the Piano API in Looker Studio, various approaches are possible. Solutions include creating multiple pages in Looker Studio, multiplying Piano data sources per user in Looker, and exporting data from Piano to BigQuery for reimporting into Looker Studio.
5) Comparing Data Between Piano Reports and Looker Studio
Specificity of Piano: The tool offers an eco mode that uses a statistical approximation process to provide your data more quickly while reducing your environmental impact. This mode presents a deviation rate from actual data of less than 2%.
Limitation in Looker: The eco mode may sometimes be enabled by default in Piano, leading to discrepancies between the eco mode data in Piano and the data in Looker Studio.
Solution: It is recommended to disable the eco mode to compare data from API calls with data from Piano interfaces.

To further explore your Piano Analytics data securely, you can opt for the use of the Snowflake feature (a Cloud Data Warehouse). This model provides direct access to your raw data via SQL queries and is compatible with various BI solutions, including Looker Studio.
This option is ideal for advanced and customized projects, allowing you to exceed the limitations of the Piano Analytics X Looker connector. To benefit from this, you must subscribe to the Piano Analytics product option “Data Sharing – delivered to your database” and be a Snowflake client.
Key takeaways: It is important to disable eco mode in Piano Analytics for an accurate comparison of data with Looker Studio. Additionally, using the Snowflake connector is recommended to explore data securely and exceed the limitations of the Piano Analytics X Looker connector.
If you have any additional tips to share, please feel free to send them to us at: mirana.rakotoarivony@converteo.com
Contributors: Swann DEFFUANT / Ismaël THIAM